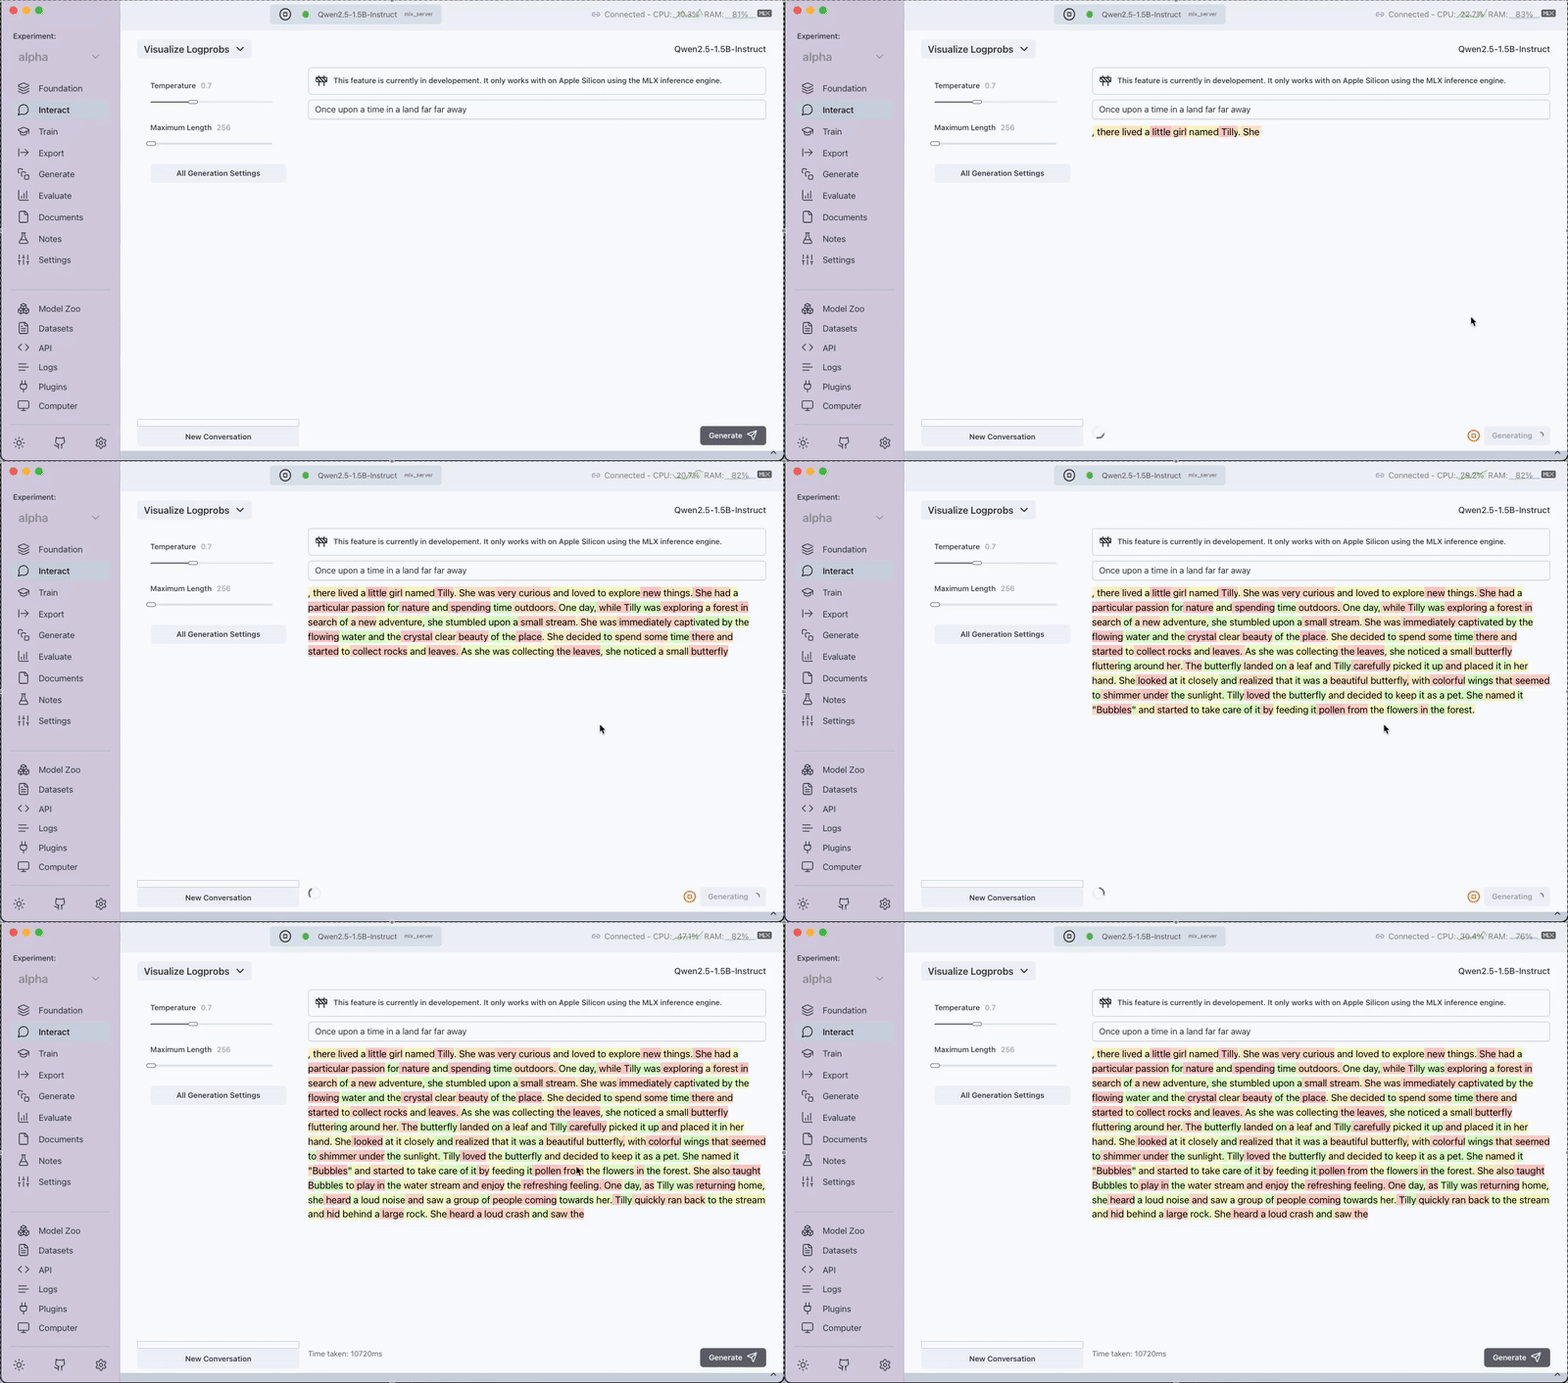
Visualize Logprobs
The Visualize Logprobs interface is an experimental feature under development and is currently available only with the MLX inference engine. This feature provides a visual representation of the log probabilities (logprobs) associated with each token in the generated completion.
How It Works
- Input Text: Enter the text for which you want to generate a completion.
- Generate: Click the generate button.
- Visualization: The generated completion is displayed with tokens highlighted in different colors. Hover over any token to view its logprobs percentage.

Benefits
- Detailed Insights: Gain an understanding of the model's confidence levels for each output token.
- Interactive Analysis: Hover over tokens to see precise probability metrics, helping you better interpret model responses.
Note
This feature is still under development and currently works exclusively with the MLX inference engine.